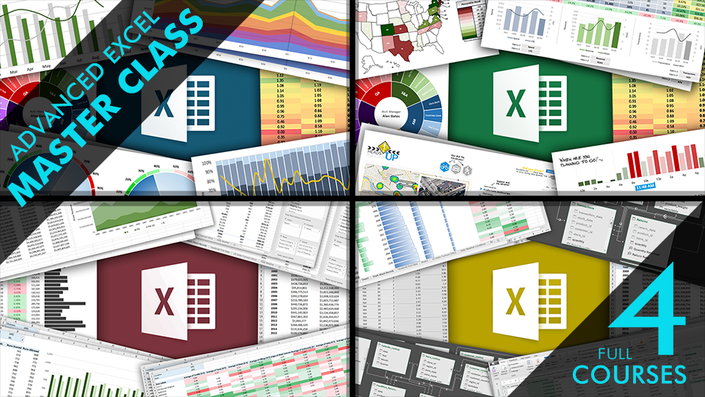
Microsoft Excel: The Master Class
4 Best-Selling Courses in One: Formulas & Functions, Charts & Graphs, Pivot Tables, and Power Pivot & DAX
Enroll in Course
ABOUT THIS COURSE
This Master Class combines 4 best-selling Excel Maven courses, including:
- Advanced Excel Formulas & Functions
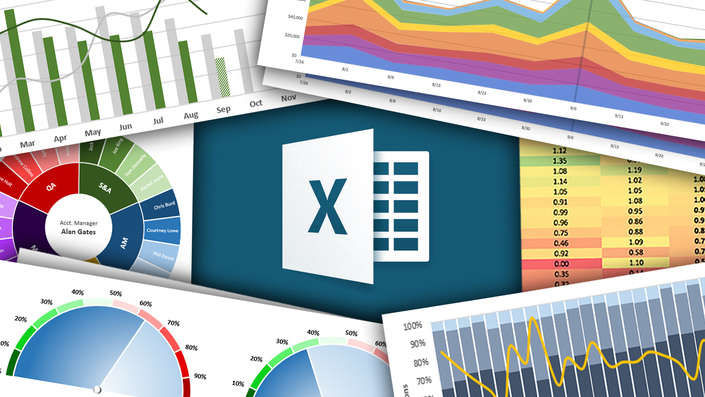
- Data Visualization with Charts & Graphs
- Data Analysis with Pivot Tables & Pivot Charts
- Intro to Power Query, Power Pivot & DAX
If you're looking to ramp up your analytics skills and absolutely revolutionize the way you manage, analyze, and visualize data, this course is for you.
With lifetime access to 24+ HOURS of interactive demos, case studies, quizzes and homework exercises, you will emerge a certified Excel wizard -- or your money back.
Courses Included with Purchase

WHAT WILL YOU LEARN?
ADVANCED FORMULAS & FUNCTIONS
 Master 75+ formulas and functions to help you explore and analyze your data in Excel, including text formulas, conditional statements, statistical functions, date & time operators, arrays, formula-based formatting tools, and much more. I will not train you to memorize formula syntax; I will teach you how to think like Excel.
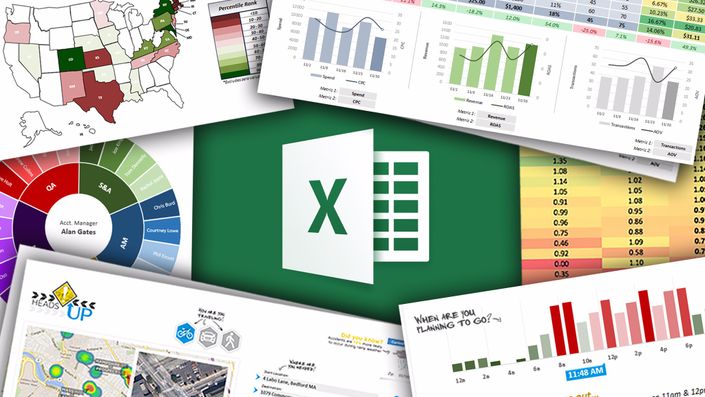
DATA VISUALIZATION WITH CHARTS & GRAPHS
 This course provides a deep, 100% comprehensive review of Excel's latest data visualization tools and techniques. I'll show you when, why, and how to use 20+ chart templates, introduce key data visualization best practices, and guide you through interactive, hands-on demos and exercises every step of the way.
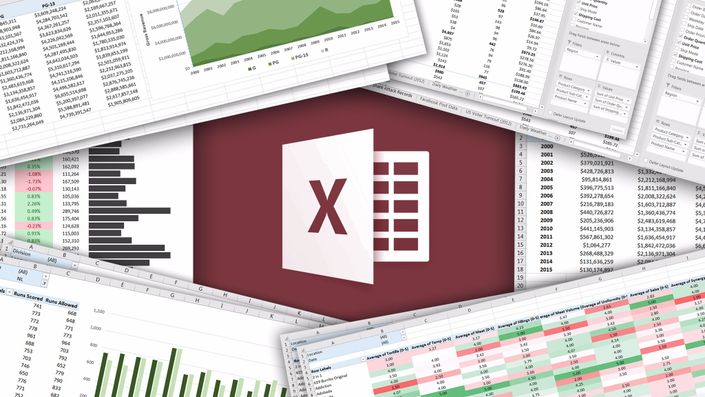
DATA ANALYSIS WITH PIVOT TABLES
 Take your analytics skills to the next level and master one of Excel's most powerful tools: Pivot Tables. This course covers all of the tools and techniques that you need to get up and running, and includes 10 hands-on case studies to showcase how these concepts can be applied to a variety of unique, real-world cases.
POWER QUERY, POWER PIVOT & DAX
 Go from analyst to data hero with Excel's advanced data modeling and business intelligence tools. In this course I'll show you how to connect and blend data sources, build custom relational data models, and analyze hundreds of millions of rows with data analysis expressions (DAX) -- ALL inside of Excel.
who IS THIS COURSE FOR?
- Anyone looking to become an Excel power user and supercharge their analytics skill set
- Excel users looking to unlock more powerful tools and advanced techniques
- Students looking for a comprehensive, engaging, and highly interactive approach to training
- These courses are designed for PC/Windows users
- NOTE: Power Pivot & DAX requires a compatible version of Excel. Please visit support.office.com for the latest list of compatible versions.

"I'm less of an expert at breathing than Chris is at Excel. These courses are thorough and well-planned, and he presents in a manner that simplifies the complicated. Well worth your time!"
- Tim Britt

"Hands down, the BEST Excel courses I've taken. I was blown away in the first 30 minutes - but that was nothing compared to the rest of the lessons.
The real-world examples and case studies made complex concepts easy to grasp. Thanks Chris!"
- Craig John

"I have just completed the course and can honestly say that it's the best I've taken in my life.
Chris has a real gift of explaining more difficult Excel functions and making them accessible and understandable. I thought I already knew Excel well but I have learned so much, and have already put a lot of it into practice at work. I love Chris's teaching style so much I have already purchased his other courses and can't wait to get started!"
- Jen Knights
Meet Your Instructor
Chris Dutton is a certified Excel expert, EdTech entrepreneur, and best-selling instructor with 10+ years specializing in data visualization and business intelligence.
As Founder and COO of Maven Analytics, Chris’ work has been featured by Microsoft, HuffPost, Entrepreneur.com and the New York Times, reaching more than 500,000 students around the world. A leader in analytics education, Maven Analytics seeks to empower everyday people to change the world with data. Chris graduated summa cum laude and received the Charles Bluhdorn Prize in Economics at Tufts University.
