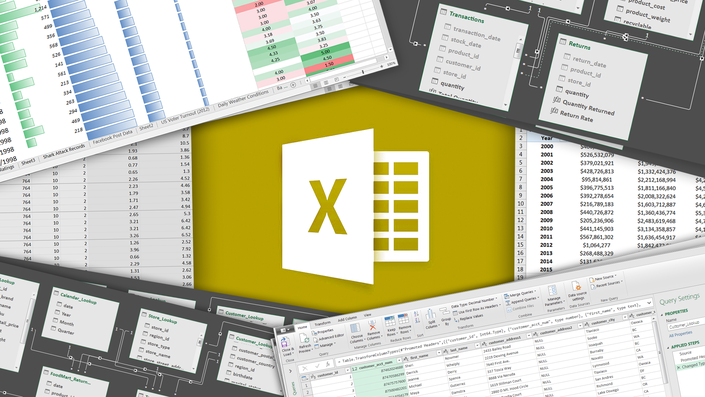
Intro to Power Query, Power Pivot & DAX
Up & running with Excel's data modeling & business intelligence tools, with a best-selling instructor
Watch Video
ABOUT THIS COURSE
This course introduces Microsoft Excel's powerful data modeling and business intelligence tools: Power Query, Power Pivot, and Data Analysis Expressions (DAX).
Using project files and hands-on demos, we’ll load and transform raw files with Power Query, create table relationships with Excel’s Data Model, and use Power Pivot and DAX to explore and analyze our data with powerful calculated fields.
If you're looking to become a power Excel user and absolutely supercharge your analytics, this course is the A-Z guide that you're looking for.
WHAT WILL YOU LEARN?
We'll kick things off by introducing the "Power Excel" landscape, and explore what these tools are all about and why they are changing the world of self-service business intelligence.
Using sample data from a fictional supermarket chain, we'll get hands-on with Power Query; a tool to extract, transform, and load data from flat files, folders, databases, API services and more. We'll practice shaping, blending and exploring our project files, and create completely automated loading procedures with only a few clicks.
From there we'll dive into Data Modeling 101, and cover the fundamentals of database design and normalization (including table relationships, cardinality, hierarchies and more). We'll take a tour through Excel's data model interface, introduce some best practices and pro tips, and then create our own relational database to analyze throughout the course.
Next, we'll use Power Pivot and DAX to explore and analyze our data model. Unlike traditional pivots, Power Pivot allows you to analyze hundreds of millions of rows across multiple data tables, and create supercharged calculated fields using a formula language called Data Analysis Expressions (or "DAX" for short). We'll cover basic DAX syntax, then introduce some of the most powerful and commonly-used functions -- CALCULATE, FILTER, SUMX and more.
If you're ready to take your Excel game to new heights and join the leading edge of analytics & business intelligence, this course is for you. It's time to stop fighting with tedious, manual tasks and struggling with "old-school" Excel; join me on this journey and emerge a certified NINJA.
Regular Price
$175
Today's Price
Only $29
Savings
Over 85% OFF

"I am a self-taught PowerQuery user and it took me a while to understand what each tool does and how it interacts with others. Thanks to your introduction I finally nailed it in a very clear, unambiguous way. You are helping me build a method that I can confidently apply to my data. Thank you so much!"
- Francesca C.

"I'm less of an expert at breathing than Chris is at Excel. This course is thorough and well-planned, and he presents in a manner that simplifies the complicated. Well worth your time!"
- Tim B.

"He is a wonderful teacher who truly explains the "why" behind his methods and showcases concepts in a clear, tangible way."
- Jessica A.
WHAT'S INCLUDED IN THE COURSE?
- LIFETIME access to all content
- Downloadable project files and resources
- Unique, hands-on demos and case studies
- Course quizzes & homework exercises
- Certificate of Completion
- 100% MONEY-BACK GUARANTEE
who IS THIS COURSE FOR?
- Excel users who want to learn more advanced data modeling & business intelligence tools
- Anyone looking to become a power Excel user and supercharge their analytics skill set
- Students looking for a comprehensive, engaging, and highly interactive approach to training
Some Things to Note:
- IMPORTANT: You need a version of Excel that is compatible with Power Pivot (Excel 2013/2016 Standalone, Office 365 Pro Plus, Enterprise E3/E5, Office Professional 2016, etc.)
- This course is designed for PC users (Power Pivot is currently unavailable with Excel for Mac)
- Experience with Excel Pivot Tables and cell formulas & functions is strongly recommended
Meet Your Instructor

Chris Dutton is a certified Excel expert, EdTech entrepreneur, and best-selling instructor with 10+ years specializing in data visualization and business intelligence.
As Founder and COO of Maven Analytics, Chris’ work has been featured by Microsoft, HuffPost, Entrepreneur.com and the New York Times, reaching more than 500,000 students around the world. A leader in analytics education, Maven Analytics seeks to empower everyday people to change the world with data. Chris graduated summa cum laude and received the Charles Bluhdorn Prize in Economics at Tufts University.

Course Curriculum
-
StartIntroduction (0:27)
-
StartMeet Power Query (aka "Get Data") (2:40)
-
PreviewThe Query Editor (3:17)
-
StartData Loading Options (1:40)
-
StartIMPORTANT: Updating Locale Settings
-
StartBasic Table Transformations (8:06)
-
StartText-Specific Tools (10:17)
-
StartNumber-Specific Tools (7:41)
-
StartDate-Specific Tools (7:39)
-
StartPRO TIP: Creating a Rolling Calendar (5:02)
-
StartAdding Index & Conditional Columns (7:44)
-
StartGrouping & Aggregating Data (7:10)
-
PreviewPivoting & Unpivoting (8:52)
-
StartModifying Workbook Queries (4:18)
-
StartMerging Queries (7:43)
-
StartAppending Queries (5:49)
-
StartConnecting to a Folder of Files (9:32)
-
StartPower Query Best Practices (2:44)
-
StartQUIZ: Power Query
-
StartHOMEWORK: Power Query
Frequently Asked Questions
Regular Price
$175
Today's Price
Only $29
Savings
Over 85% OFF
